
Author-Debra Jones

Last updated-Feb 28, 2026
Ever wondered why some processes feel slow, confusing, or full of unnecessary steps? What if you could actually see where time is being wasted and where real value is created? That’s exactly where Value Stream Mapping comes in. Instead of guessing what’s working and what’s not, VSM gives you a clear visual view of how work flows from start to finish, helping you uncover delays, bottlenecks, and hidden inefficiencies.
So, how can you use VSM to improve your processes? In this blog, we’ll explore value stream mapping in detail, including when to use it, how to create it, its key benefits, and how it works through a practical example. Let’s get started!
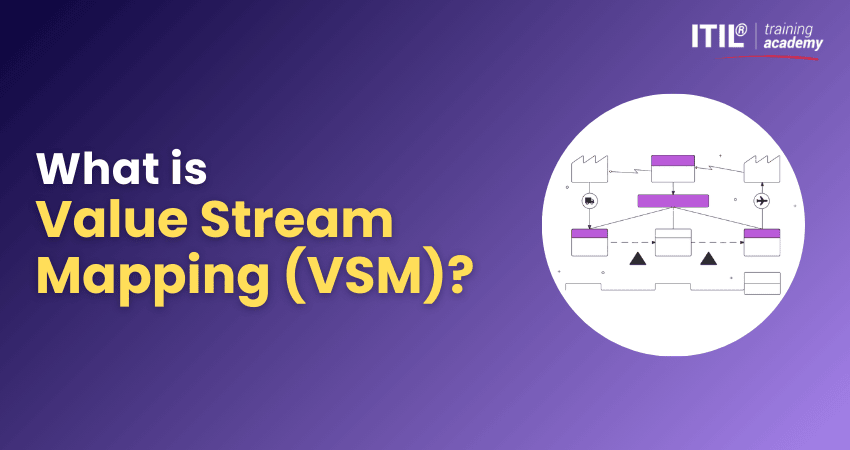
What is Value Stream Mapping?
Value Stream Mapping (VSM) is a Lean management technique used to visualise and analyse the flow of materials, information, and activities involved in delivering a product or service. It helps organisations understand how processes operate from start to finish and identify inefficiencies, delays, and non-value-adding steps.
By mapping the current state and designing an improved future state, teams can reduce waste, improve workflow efficiency, and enhance overall performance. Value Stream Mapping also supports better decision-making and helps deliver faster, more consistent, and customer-focused outcomes.

History of Value Stream Mapping (VSM)
Value Stream Mapping (VSM) traces its roots to early 20th-century manufacturing innovations. Henry Ford pioneered continuous flow production in 1913 at his Highland Park plant for the Model T. Charles E. Knoeppel's 1918 book Installing Efficiency Methods featured diagrams of material and information flows, predating Toyota.
Toyota advanced these ideas in the 1950s via the Toyota Production System (TPS), led by Taiichi Ohno, adapting Ford's methods for product variety. Modern VSM emerged in Toyota's 1980s supplier consulting, termed "material and information flow mapping". Popularised by Mike Rother and John Shook's 1998 Learning to See, and named by Womack and Jones in 1996's Lean Thinking, it now optimises processes beyond manufacturing.
When Should You Use Value Stream Mapping?
You should use Value Stream Mapping when you need to visualise, analyse, and improve the flow of materials and information within a process. It is particularly useful for identifying inefficiencies, eliminating waste, and enhancing overall process performance.
Here are the key situations where Value Stream Mapping is most effective:
1) When improving end-to-end workflows to increase efficiency and visibility
2) When identifying bottlenecks, delays, or workflow inefficiencies
3)When reducing waste and optimising operational processes
4) When analysing complex processes with multiple steps or dependencies
5) When improving service delivery, production, or operational performance
6) When aligning processes with business goals and customer expectations
7) When supporting Lean, Six Sigma, or continuous improvement initiatives
Value Stream Mapping is most beneficial when organisations need a clear, visual understanding of how workflows and where improvements can be made.
How to Create a Value Stream Map: A Step-by-step Guide
Creating a Value Stream Map involves a set of structured steps to help organisations visualise processes, identify inefficiencies, and improve design. Let's look at the steps below:
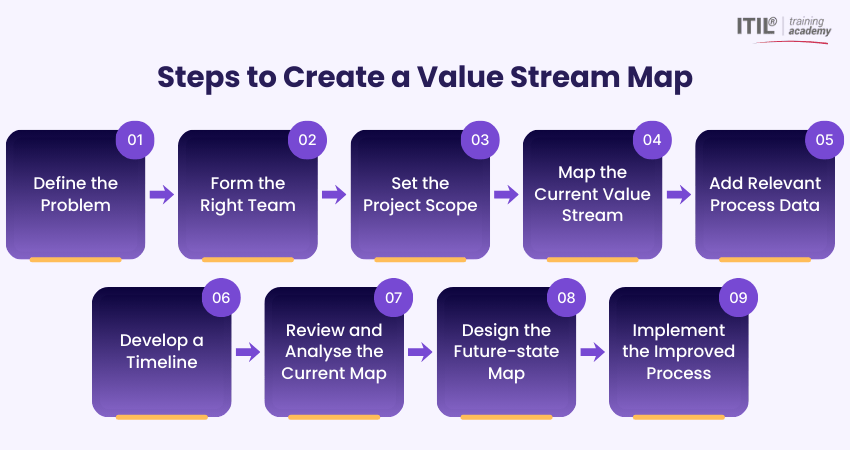
1) Define the Problem
In the first step, clarify the issue you want to address. Value Stream Mapping can be used to solve specific challenges, such as mismatched customer demand and inventory levels. At this stage, brainstorm with your team, ask probing questions, and consider both internal inefficiencies and external customer pain points.
2) Form the Right Team
Then, assemble a cross-functional team responsible for mapping and analysing the Value Stream. Add members from departments, such as sales, operations, customer service, and design, to ensure diverse perspectives. In some cases, involving suppliers or external stakeholders can provide valuable insights.
3) Set the Project Scope
After building an effective team, decide whether to map the entire product lifecycle or focus on specific steps. It is crucial to keep the scope manageable by mapping one product at a time and avoiding conditional steps that occur after delivery. This ensures clarity and prevents efforts from getting wasted.
4) Map the Current Value Stream
Now, use standard VSM symbols to visualise how information, products, and time flow through the business process. Generally, a map includes three layers: information flow at the top, product flow in the middle, and time flow at the bottom. Begin with a key handoff point, such as customer requests, and build outward.
5) Add Relevant Process Data
Afterwards, enhance your map with relevant metrics to make inefficiencies transparent. You must include common data points, such as cycle time, transfer time, or inventory levels. Remember to tailor the data to your specific industry, such as manufacturing, office work, or supplier processes.
Some common process data you can include:
1) Inventory levels at each step
2) Cycle time per unit
3) Transfer time
4) Team members required per step
5) Scrap rates and batch sizes
6) Takt time (rate needed to meet demand)
6) Develop a Timeline
Now, by using a time ladder, dedicate the bottom section of your map to time flow. Track lead time (total time from request to delivery) and cycle time (actual value-added work time). This helps to identify delays, predict inventory needs, and assess whether processes will meet customer expectations.
7) Review and Analyse the Current Map
Review the map to identify areas of waste, such as overproduction, defects, or fragmented teams. Here, you can use the Kaizen bursts, such as short, focused improvement sessions, to generate ideas for eliminating waste. This step ensures you move from the observation stage to executing actionable solutions.
8) Design the Future-state Map
Create a new map that incorporates improvements identified during the analysis step. Here, use Lean tools, such as Kanban systems, to implement pull-based workflows, reduce waste, and improve flow. Add appropriate VSM symbols, such as supermarkets, Kanban posts, or material pulls, to represent the redesigned process.
9) Implement the Improved Process
In the final stage, put your future state map into practice. Initially, implementation may be disruptive, but it will lead you towards a streamlined workflow, reduced waste, and improved customer satisfaction. Also, keep monitoring results and refining continuously to sustain improvements.
Lead modern IT services effectively and drive real value with
ITIL® 4 Foundation Training
now!
Benefits of Value Stream Mapping
Value Stream Mapping is a critical tool for business sustainability. It not only highlights inefficiencies but also drives cultural and customer-focused improvements. Let’s look at the key benefits it brings below:
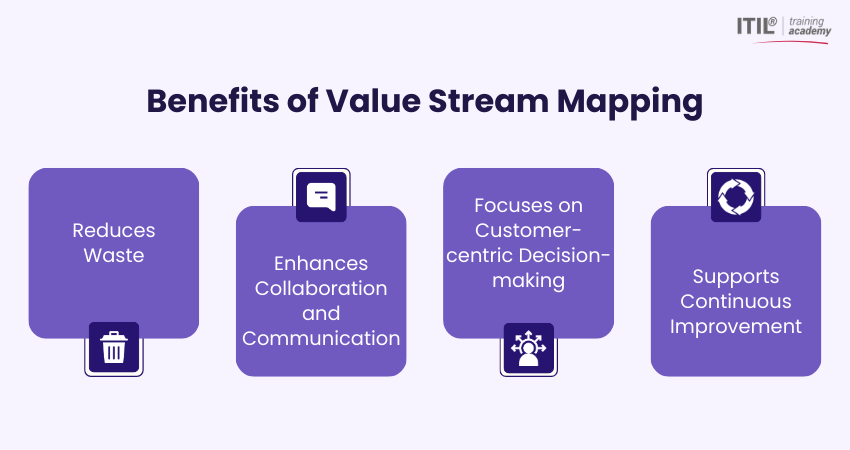
1) Reduces Waste
Value Stream Mapping helps organisations to find out the root causes of inefficiencies, be it in inventory, handoffs, or delays. This ensures that eliminating waste improves productivity, reduces costs, and strengthens overall business operations.
2) Enhances Collaboration and Communication
Value Stream Mapping helps to identify wasteful handoffs. This enables teams to consciously improve how they communicate and work together. VSM fosters a culture of transparency, encouraging better communication and collaboration across departments.
3) Focuses on Customer-centric Decision-making
Value Stream Mapping ensures that improvements are prioritised based on the customer’s perspectives. Aligning decisions based on customer requirements helps teams focus on delivering real value and improving customer satisfaction and loyalty.
4) Supports Continuous Improvement
Value Stream Mapping makes processes visible, which provides a solid foundation for delivering operational and workflow optimisation. Teams can revisit maps regularly to adapt to changing demands and maintain operational excellence.
Key Challenges in Value Stream Mapping
Although Value Stream Mapping provides excellent benefits, it brings its own set of challenges that organisations must manage carefully. Let’s look at the challenges below:
1) Data Accuracy Issues:
Incomplete or incorrect process data can lead to misleading maps and result in poor analysis and decision-making.
2) Time-Consuming Process:
Creating a detailed current-state map requires significant time, effort, and coordination across multiple teams.
3) Lack of Stakeholder Buy-in:
Resistance or lack of support from stakeholders can slow down mapping activities and delay improvement implementation.
4) Difficulty in Identifying Hidden Waste:
Some inefficiencies, such as delays, bottlenecks, or rework, are not immediately visible and require deeper analysis.
5) Complex Processes:
Highly complex workflows can make Value Stream Mapping difficult to create, understand, and interpret effectively.
6) Limited Cross-functional Collaboration:
Organisational silos between departments can hinder complete end-to-end process visibility.
7) &Keeping Maps Updated:
Business processes evolve over time, and value stream maps must be regularly reviewed and updated to remain relevant.
8) Overemphasis on Tools vs Thinking:
Teams may focus too much on creating diagrams rather than identifying and implementing actual process improvements.
9) Insufficient Training:
Lack of proper Value Stream Mapping knowledge and training can result in inaccurate mapping and ineffective improvement efforts.
10) Implementation Gap:
While identifying improvement opportunities is important, executing and sustaining those improvements can be more challenging.
Prove your IT service expertise with
ITIL® Version 5 Foundation Certification
– Sign up now!
Best Practices for Value Stream Mapping
Adopting and following the best practices ensures that your Value Stream Mapping activity delivers meaningful insights. Let's look at the best practices below:
1) Define Clear Objectives:
Identify what process you want to improve and why.
2) Select the Right Process:
Focus on high-impact processes that affect efficiency or customer value.
3) Involve Cross-functional Teams:
Include people from all relevant departments for accurate mapping.
4) Map the Current State First:
Understand the existing workflow before planning improvements.
5) Use Accurate Data:
Base the map on real data such as cycle time and delays.
6) Keep the Map Simple:
Avoid unnecessary complexity to maintain clarity.
7) Focus on Customer Value:
Identify steps that add value and eliminate waste.
8) Create a Future State Map:
Design an improved version of the process.
9) Prioritise Improvements:
Focus on changes that deliver the greatest impact.
10) Review and Update Regularly:
Keep the map current as processes evolve.
Standard Symbols Used in Value Stream Maps
Value Stream Maps utilise a set of standardised symbols to represent how information flows. These symbols make maps understandable and ensure consistency across teams. Some key symbols include:
1) External Company:
Represents suppliers or customers. Shows where the process starts and ends.
2) Cell:
A process area where work is performed and value is added.
3) Production Kanban:
A signal that triggers production based on demand.
4) Data Box:
Displays process details like cycle time, lead time, uptime, and operators.
5) FIFO:
Ensures materials move in First-In-First-Out order without overtaking.
6) Supermarket:
A controlled inventory point used in pull systems.
7) Level Load:
Balances production to ensure smooth workflow.
8) Inventory:
Materials waiting between process steps.
9) Truck:
Represents transportation of materials or products.
10) MRP:
System-based planning for materials and production.
11) Operator:
A person performing process tasks.
12) Manual Info Flow:
Information shared via paper, phone, or verbal methods.
13) Pull:
Production based on actual demand.
14) Push:
Production based on forecast.
15) Electronic Info Flow:
Information shared through digital systems.
16) Shipment:
Movement of finished goods to customers.
17) Withdrawal Kanban:
Signal to move materials from inventory to process.
18) Safety Stock:
Extra inventory kept to avoid shortages.
Real-world Examples of Value Stream Mapping
This Value Stream Mapping example shows how an e-commerce order moves from the customer to the final shipment. The process begins with order confirmation, followed by inventory storage, where products are held until required. The pull system ensures that picking and packing happen only when there is actual demand, reducing unnecessary work and excess inventory.
Electronic information flow connects the customer, processes, and shipment for smooth coordination. The timeline shows a total lead time of 1.5 hours, while only 15 minutes add value. This highlight waiting time and helps organisations identify opportunities to improve efficiency and reduce delays.
Conclusion
Value Stream Mapping is a strategic approach to identify inefficiencies, align teams, and drive customer-focused improvements. Applying VSM effectively helps businesses to reduce waste, enhance collaboration, and continuously refine their processes to stay competitive. The discipline of mapping Value Streams ensures that every effort contributes to sustainable growth and higher customer satisfaction.
Build solid foundations of IT service skills with
ITIL® Foundation Level Training
today!
Frequently Asked Questions?
No FAQs available for this blog.
Most Recent
Date - Jul 11, 2026
Date - Jul 11, 2026
Date - Jul 4, 2026